7 基础统计绘图
这一小节的内容将会持续更新,详情请关注更新日志。
7.1 曼哈顿图
曼哈顿图是一种常用的GWAS结果可视化方法,它通过将每个SNP的p值转换为负对数尺度,并在x轴上表示SNP的位置,在y轴上表示p值,从而直观地展示GWAS结果。在图中,显著的结果(p值较小)会显示为高亮的点,而未显著的结果则显示为较暗的点。曼哈顿图可以帮助研究者快速识别出显著关联的SNP,并进一步分析其功能。
7.1.1 加载R包
7.1.2 构建GWAS数据
simulateGWAS函数模拟基因组关联研究 (GWAS) 数据, 其中有100,000个单核苷酸多态性 (SNPs) 和3个显著列。
然后,使用 janitor::clean_names() 来标准化数据框的列名。
head(gwas_data_load) chr snp bp nmiss beta se r2 t
1 1 rs37706406 463758 19882 0.0029864364 0.25622430 1.292083e-04 2.3273699
2 1 rs10011667 567266 19987 0.0102220228 0.15317258 3.316500e-05 -1.9720065
3 1 rs46291958 694606 20011 0.0601440093 0.08921205 7.115235e-05 -0.0418025
4 1 rs48634113 1852741 19976 0.0269168093 0.04563751 2.721316e-05 -1.4420942
5 1 rs21562068 1886010 19964 0.0452142227 0.19233830 2.154977e-05 -0.2692923
6 1 rs74512906 126411 20018 0.0001694101 0.06042490 2.751615e-05 0.1498507
p
1 0.87891579
2 0.05683218
3 0.76140842
4 0.83767710
5 0.22275352
6 0.19437160从模拟的GWAS数据中选择所有 p 值小于 0.05 的行,这些行代表统计上显著的结果。
模拟的GWAS数据中选择所有 p 值大于或等于 0.05 的行,这些行代表非显著的结果。
然后按染色体(chr)对这些非显著结果进行分组。
对每个染色体组抽取20%的样本,进行数据降采样。
将显著和非显著的数据行合并回一个单一的数据框中。
sig_data <- gwas_data_load |> subset(p < 0.05)
notsig_data <- gwas_data_load |>
  subset(p >= 0.05) |>
  group_by(chr) |>
  sample_frac(0.2)
gwas_data <- bind_rows(sig_data, notsig_data)
对合并后的数据按染色体分组,并计算每个染色体组的最大基对位置(max_bp)。
使用 cumsum 函数计算每个染色体组的累积最大基对位置,并通过lag函数将这些值错位,以便于后续的累积位置计算。
lag函数会将数据框或向量中的每一行向前移动指定的位置,并返回移动后的值。
选择染色体和累积基对位置的错位值(bp_add)
data_cum <- gwas_data |>
  group_by(chr) |>
  summarise(max_bp = max(bp)) |>
  mutate(bp_add = lag(cumsum(max_bp), default = 0)) |>
  select(chr, bp_add)
head(data_cum)
# A tibble: 6 × 2
chr bp_add
<int> <dbl>
1 1 0
2 2 2199742
3 3 4299076
4 4 6297344
5 5 8196932
6 6 9996391将累积基对位置数据与原始GWAS数据合并。
计算每个SNP的累积基对位置(bp_cum),这有助于后续的可视化或分析。
gwas_data <- gwas_data |>
  inner_join(data_cum, by = "chr") |>
  mutate(bp_cum = bp + bp_add)
对每个染色体分组的数据计算累积基对位置的平均值,用于确定每个染色体在后续图表的中心位置。
找出具有最小 p 值的行,计算其对数变换后的 p 值,并确定y轴的极限 (ylim) ,以便于在图表中突出显示最显著的结果。
计算Bonferroni校正后的显著性阈值。这是通过将0.05除以GWAS数据中的行数(即测试的总数)来实现的,用于调整多重比较的影响。
7.1.3 绘制曼哈顿图
ggplot(gwas_data, aes(
  x = bp_cum, y = -log10(p),
  color = as_factor(chr), size = -log10(p)
)) +
  # x轴为累积基对位置(bp_cum),y轴为负对数p值(-log10(p)),颜色和大小由染色体(chr)和p值决定。
  geom_hline(
    yintercept = -log10(sig),
    color = "grey40", linetype = "dashed"
  ) +
  # 添加一条水平虚线,表示经过Bonferroni校正的显著性阈值。
  geom_point(alpha = 0.5) + # 添加散点图的点,透明度设置为0.5。
  scale_x_continuous(
    label = axis_set$chr,
    breaks = axis_set$center
  ) +
  # 设置x轴的刻度标签和断点,使其对应于染色体的中心位置
  scale_y_continuous(expand = c(0, 0), limits = c(0, ylim)) + # 设置y轴的范围和扩展。
  scale_color_manual(values = rep(
    c("#788FCE", "#E6956F"),
    length(axis_set$chr)
  )) +
  # 手动设置颜色,为每个染色体分配不同的颜色。
  scale_size_continuous(range = c(0.5, 3)) + # 设置点的大小范围。
  labs(x = NULL, y = "-log<sub>10</sub>(p)") + # 设置图形的标签,x轴标签为空,y轴标签为负对数p值。
  theme_minimal() +
  theme(
    legend.position = "none",
    panel.grid.major.x = element_blank(),
    panel.grid.minor.x = element_blank(),
    axis.title.y = element_markdown(),
    axis.text.x = element_text(angle = 45, size = 8, vjust = 0.5)
  )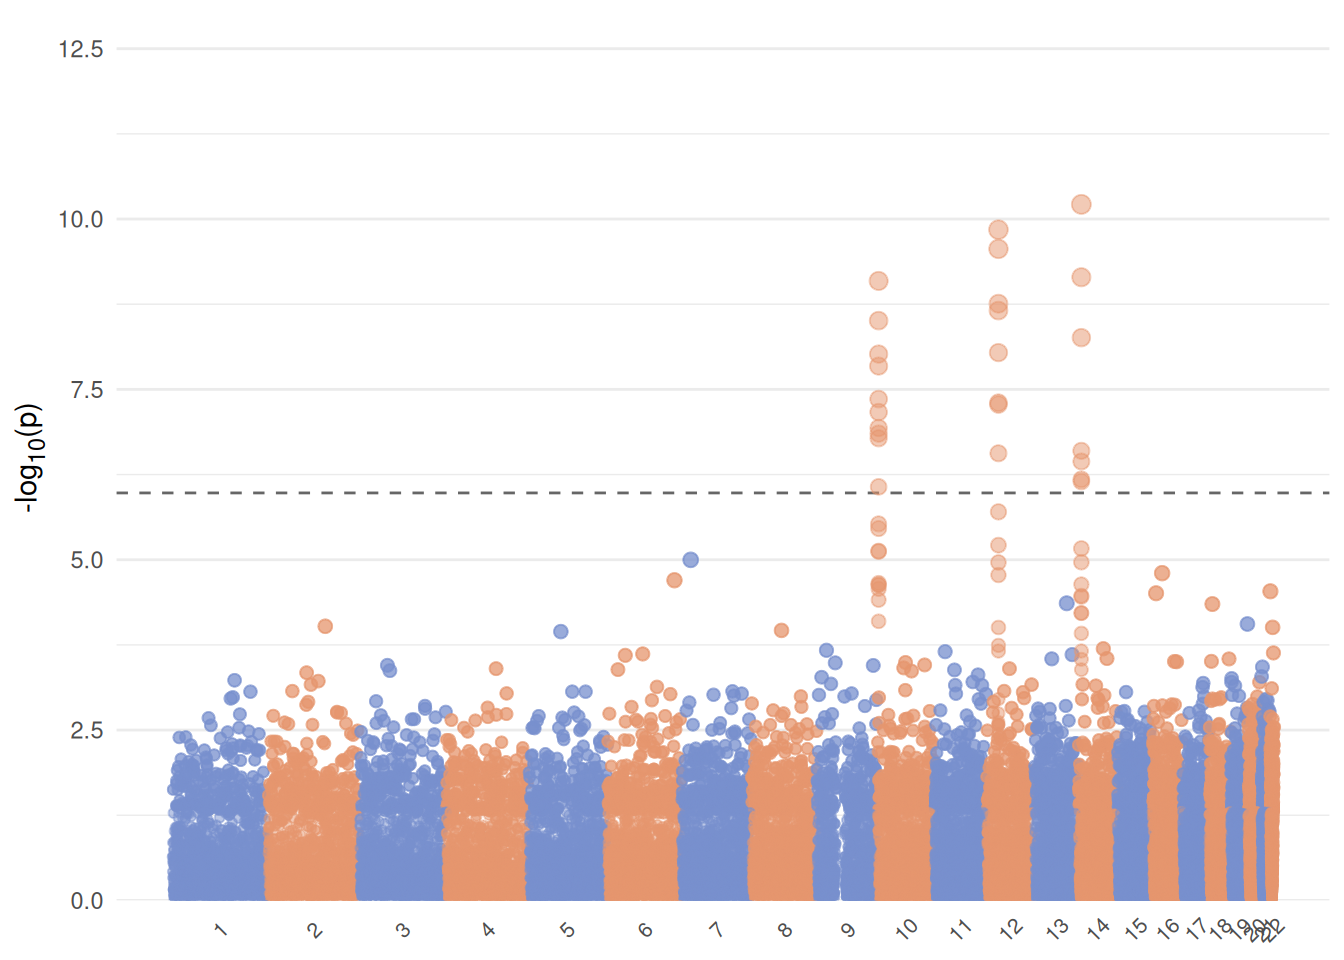
曼哈顿图由ggplot2的点图+一条直线绘制而成。gwas数据由分布在染色体上的单核苷酸突变位点构成,每个突变位点记录了它在染色体上的绝对位置和它的p-value。为了对这个数据进行可视化,我们将每个单核苷酸突变位点的位置作为x轴,它的p-value作为y轴,然后沿y轴绘制一条p-value的阈值线,就完成可视化。在实际操作过程中,需要注意每个单核苷酸突变位点在染色体上的位置,这里的数据中,单核苷酸突变位点在染色体上的位置表示为在单个染色体上的位置,比如在2号染色体的1253位点,表示为1253,而非加上染色体1的长度,所以需要转换数据。另外,x轴和y轴的标签也做了相应转换,x轴取了每个染色体的中心位置写标签,而y轴做了-log10转换。
7.2 分裂小提琴图
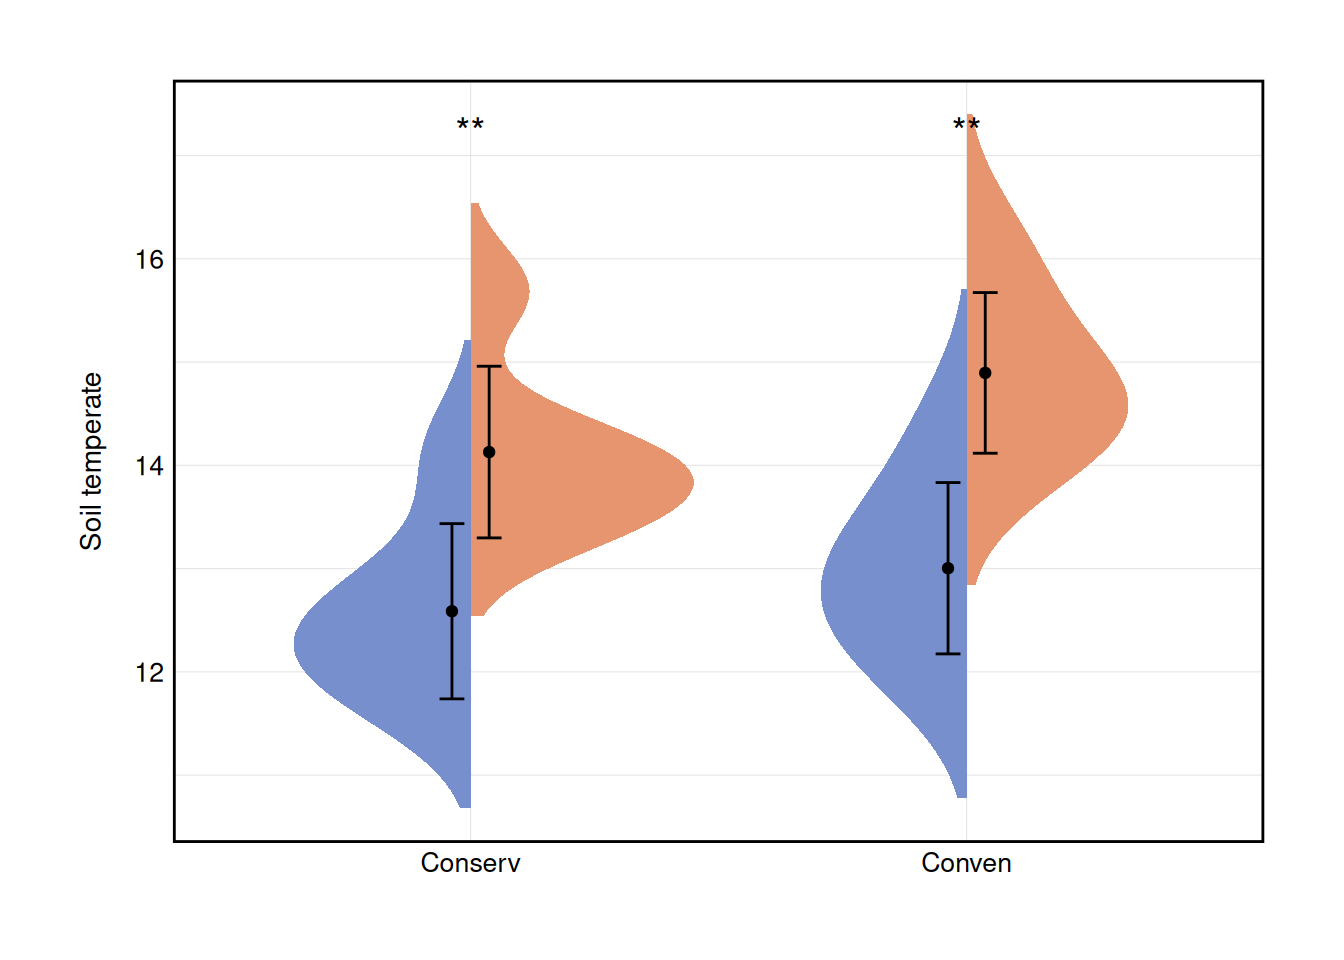
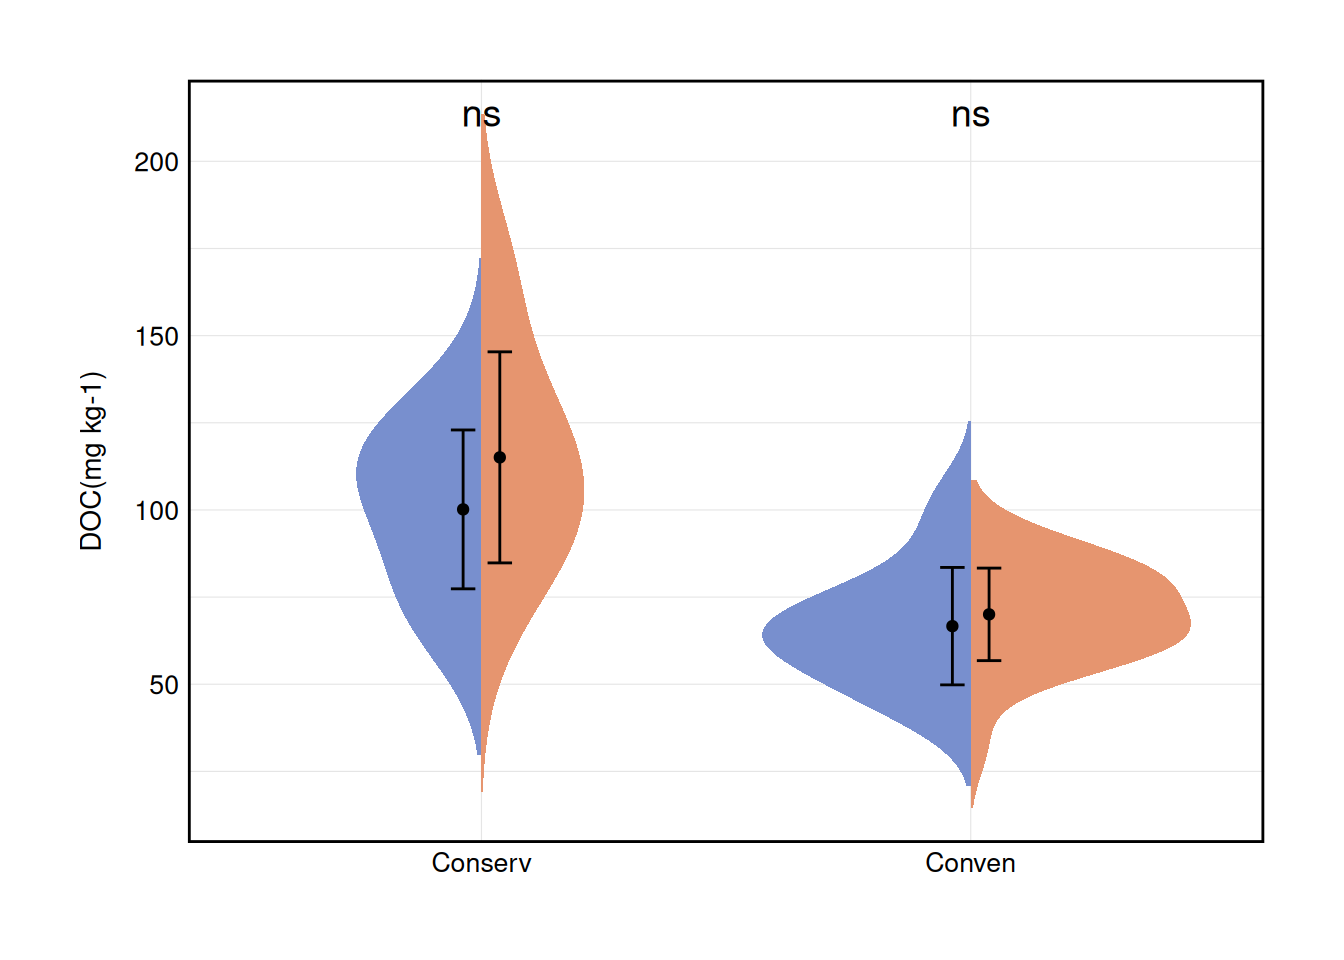
分裂小提琴图能够很方便的展示嵌套数据中两组数据的分布情况。分裂小提琴图来自introdataviz包geom_split_violin()函数,有关如何实现这个函数,请参见 Chapter 9
7.2.1 加载R包
7.2.2 加载数据
读取数据,将Treatment列数据按-拆分成A, B两列,并将A列转换成因子类型,除去B列中的数字。
df1 <- read_tsv("data/bsg/F1ag.txt") |>
  select(2, 3, -1) |>
  separate(`Treatment`, into = c("A", "B"), sep = "-", convert = TRUE) |>
  mutate(
    B = str_replace_all(B, "[0-9]", ""),
    A = as.factor(A)
  )
df2 <- read_tsv("data/bsg/F1ag.txt") %>%
  select(2, 4, -1) |>
  separate(`Treatment`, into = c("A", "B"), sep = "-", convert = TRUE) |>
  mutate(
    B = str_replace_all(B, "[0-9]", ""),
    A = as.factor(A)
  )
df3 <- read_tsv("data/bsg/F1BC.txt") |>
  select(2, 3, -1) |>
  separate(`Treatment`, into = c("A", "B"), sep = "-", convert = TRUE) |>
  mutate(
    B = str_replace_all(B, "[0-9]", ""),
    A = as.factor(A)
  )

head(df1)
# A tibble: 6 × 3
A B `SOC (g kg-1)`
<fct> <chr> <dbl>
1 Conserv Amb 12.9
2 Conserv Amb 12.1
3 Conserv Amb 11.6
4 Conserv Amb 12.8
5 Conserv Warm 12.1
6 Conserv Warm 12.17.2.3 画图
根据图层顺序依次添加
- 分裂小提琴图
- 误差线图
- 均值点图
- 两组均值t检验结果
# 定义公共主题
theme_cus <- function(...) {
  theme_cus <- theme(
    axis.text.x = element_text(
      angle = 0, hjust = 0.5, vjust = 0.5, colour = "black",
      size = 10, margin = margin(b = 2)
    ),
    axis.text.y = element_text(
      color = "black", size = 10,
      margin = margin(r = 1)
    ),
    panel.background = element_rect(fill = NA, color = NA),
    panel.grid.minor = element_line(linewidth = 0.2, color = "#e5e5e5"),
    panel.grid.major = element_line(linewidth = 0.2, color = "#e5e5e5"),
    panel.border = element_rect(
      fill = NA, color = "black",
      linewidth = 1, linetype = "solid"
    ),
    legend.key = element_blank(),
    legend.title = element_blank(),
    legend.text = element_text(color = "black", size = 8),
    legend.spacing.x = unit(0.1, "cm"),
    legend.key.width = unit(0.5, "cm"),
    legend.key.height = unit(0.5, "cm"),
    legend.justification = c(1, 0),
    legend.background = element_blank(),
    ...
  )
  return(theme_cus)
}

# 绘制分裂小提琴图
a <- ggplot(df1, aes(x = A, y = `SOC (g kg-1)`, fill = B)) +
  # 分裂小提琴图
  geom_split_violin(trim = FALSE, color = NA) +
  # 添加图例
  guides(fill = guide_legend(title = "group")) +
  # 绘制误差线
  stat_summary(
    fun.data = "mean_sd", position = position_dodge(0.15),
    geom = "errorbar", width = 0.1
  ) +
  # 将均值以点的形式添加到误差线上
  stat_summary(
    fun = mean, geom = "point",
    position = position_dodge(0.15), show.legend = FALSE
  ) +
  # 添加B列中两组均值的t检验结果
  stat_compare_means(aes(group = B),
    label = "p.signif", label.y = 15.1,
    method = "t.test", size = 5
  ) +
  scale_fill_manual(values = c("#788FCE", "#e6956f")) +
  labs(x = NULL, y = "SOC (g kg-1)") +
  theme_cus(legend.position = c(1, 0))
Warning: A numeric `legend.position` argument in `theme()` was deprecated in ggplot2
3.5.0.
ℹ Please use the `legend.position.inside` argument of `theme()` instead.g <- ggplot(df2, aes(x = A, y = `DOC(mg kg-1)`, fill = B)) +
geom_split_violin(trim = F, color = NA, adjust = 1.5) +
guides(fill = guide_legend(title = "group")) +
stat_summary(
fun.data = "mean_sd",
position = position_dodge(0.15), geom = "errorbar", width = .1
) +
stat_summary(
fun = "mean", geom = "point",
position = position_dodge(0.15), show.legend = F
) +
stat_compare_means(aes(group = B),
label = "p.signif",
label.y = 210, method = "t.test", size = 5
) +
scale_fill_manual(values = c("#788FCE", "#E6956F")) +
labs(x = NULL, y = "DOC(mg kg-1)") +
theme_cus(legend.position = "non")
b <- ggplot(df3, aes(x = A, y = `Soil temperate (℃)`, fill = B)) +
geom_split_violin(trim = F, color = NA, adjust = 1.5) +
guides(fill = guide_legend(title = "group")) +
stat_summary(
fun.data = "mean_sd", position = position_dodge(0.15),
geom = "errorbar", width = .1
) +
stat_summary(
fun = "mean", geom = "point",
position = position_dodge(0.15), show.legend = F
) +
stat_compare_means(aes(group = B),
label = "p.signif",
label.y = 17.1, method = "t.test", size = 5
) +
scale_fill_manual(values = c("#788FCE", "#E6956F")) +
labs(x = NULL, y = "Soil temperate") +
theme_cus(legend.position = "non")
# 将3个图形按行排列在一起
# a + b + g + plot_annotation(tag_levels = "A")
plot(a)
plot(b)
plot(g)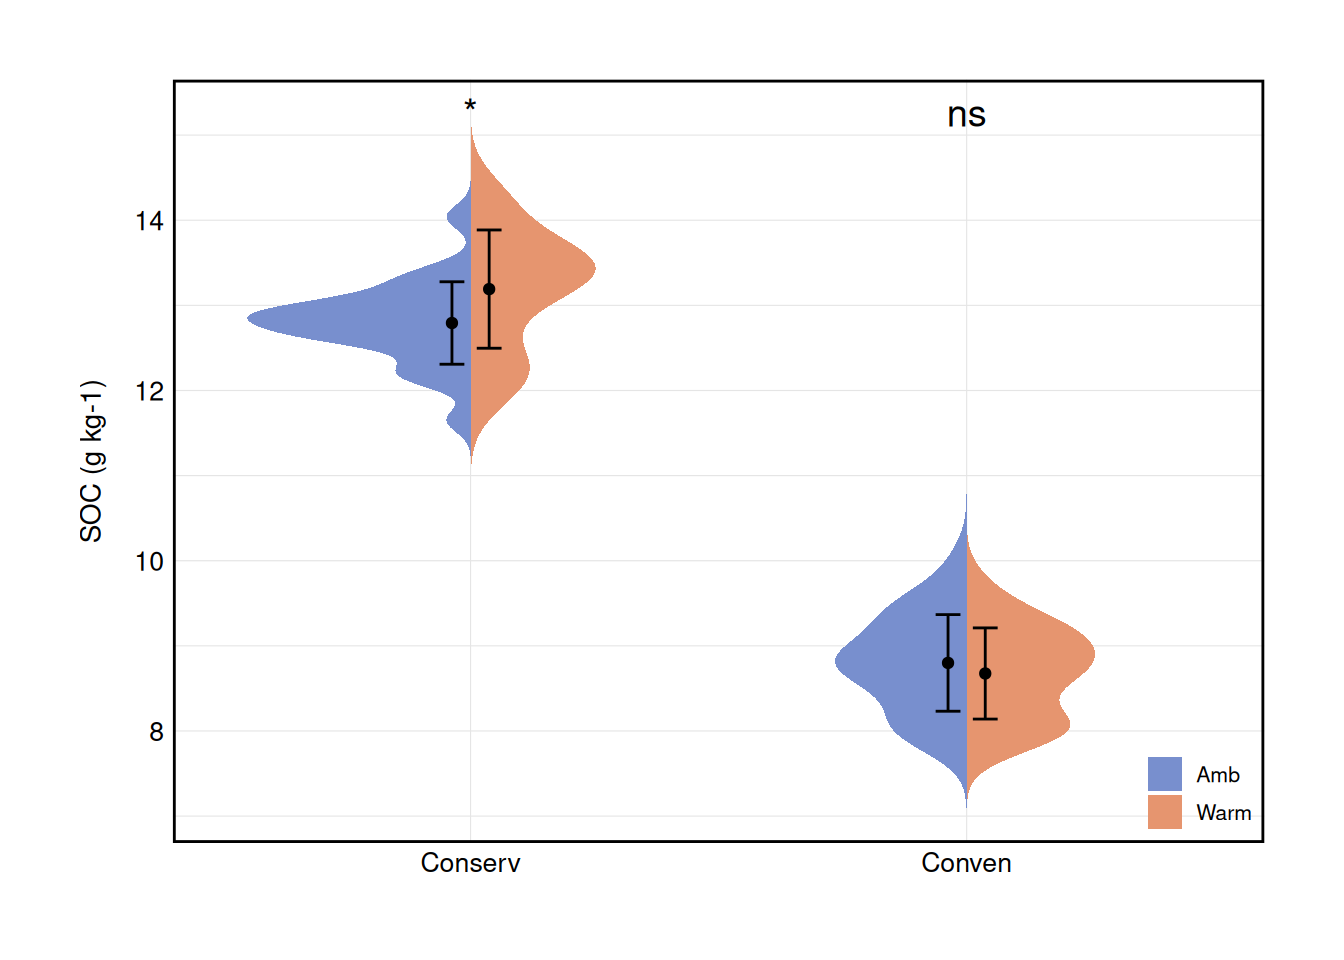
7.3 阴影条带哑铃图
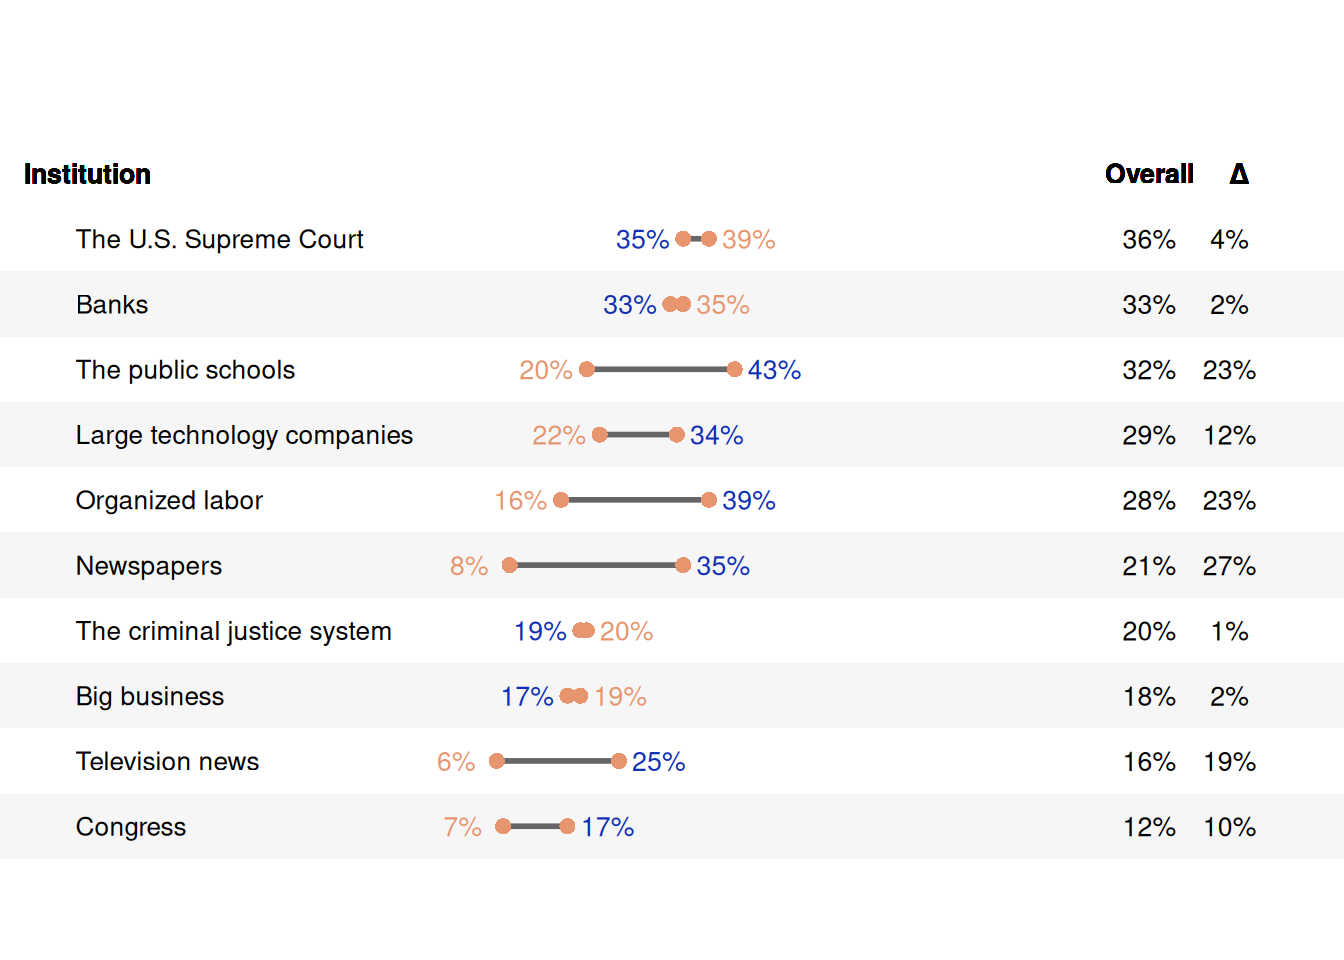
用于展示每行数据从x1增长到x2比较合适,但是该图比较难以绘制。下面的示例使用基础ggplot2对象绘制,需要使用者对ggplot2很熟悉。这个示例利用geom_rect()绘制矩形框架,然后利用geom_text()将结果绘制到对应位置。
7.3.1 加载R包
7.3.2 数据处理
df <- read_csv("data/bsg/values.csv")
df <- df |>
  mutate(across(2:4, ~ .x / 100)) |>
  arrange(Overall) |>
  mutate(
    # 添加一个新列order,包含每行的行号
    order = row_number(),
    # 根据order列的值重新排序Institution列
    Institution = fct_reorder(Institution, order)
  ) |>
  rename(cont = 1, overall = 2, x1 = 3, x2 = 4) |>
  mutate(
    diff = abs(x2 - x1),
    x1pr = percent(x1, accuracy = 1),
    x2pr = percent(x2, accuracy = 1),
    dipr = percent(diff, accuracy = 1),
    ovpr = percent(overall, accuracy = 1),
    x1nu = if_else(x1 > x2, 1, if_else(x1 < x2, -1, -1)) / 16,
    x2nu = -1 * x1nu
  )
df2 <- df |>
  # 从df中筛选出行号为偶数的行
  filter(row_number() %% 2 == 0) |>
  mutate(xmin = -2, xmax = 2)
df <- left_join(df, df2, by = colnames(df)) |>
  head(10)

df
# A tibble: 10 × 14
cont overall x1 x2 order diff x1pr x2pr dipr ovpr x1nu
<fct> <dbl> <dbl> <dbl> <int> <dbl> <chr> <chr> <chr> <chr> <dbl>
1 Congress 0.12 0.07 0.17 1 0.1 7% 17% 10% 12% -0.0625
2 Television … 0.16 0.06 0.25 2 0.19 6% 25% 19% 16% -0.0625
3 Big business 0.18 0.19 0.17 3 0.0200 19% 17% 2% 18% 0.0625
4 The crimina… 0.2 0.2 0.19 4 0.0100 20% 19% 1% 20% 0.0625
5 Newspapers 0.21 0.08 0.35 5 0.27 8% 35% 27% 21% -0.0625
6 Organized l… 0.28 0.16 0.39 6 0.23 16% 39% 23% 28% -0.0625
7 Large techn… 0.29 0.22 0.34 7 0.12 22% 34% 12% 29% -0.0625
8 The public … 0.32 0.2 0.43 8 0.23 20% 43% 23% 32% -0.0625
9 Banks 0.33 0.35 0.33 9 0.0200 35% 33% 2% 33% 0.0625
10 The U.S. Su… 0.36 0.39 0.35 10 0.0400 39% 35% 4% 36% 0.0625
# ℹ 3 more variables: x2nu <dbl>, xmin <dbl>, xmax <dbl>7.3.3 定义主题
txt_sz <- 3.5
theme_cus <- theme(
  text = element_text(size = 14),
  panel.background = element_blank(),
  axis.text.y = element_text(
    color = "black", hjust = 0,
    size = 14 / 5 * txt_sz
  ),
  axis.text.x = element_blank(),
  axis.ticks = element_blank(),
  # 这里直接设置axis.title=element_blank()不会生效,需要对x,y单独设置
  axis.title.x = element_blank(),
  axis.title.y = element_blank(),
  # 同上
  panel.grid.major = element_blank(),
  panel.grid.minor = element_blank(),
  panel.border = element_blank(),
  legend.position = "none",
  plot.title = element_text(size = rel(0.8), hjust = -1),
  plot.margin = unit(c(1, 1, 1, 1), "cm")
)
7.3.4 数据可视化
txt.sz <- 3.5
ggplot(df, aes(y = cont)) +
  # 添加矩形图层,用于背景标记,颜色为浅灰色
  geom_rect(aes(
    xmin = xmin, xmax = xmax,
    # xmin,xmax有缺失值,只绘制没有缺失值的
    ymin = as.numeric(cont) - 1.5,
    ymax = as.numeric(cont) - 0.5
    # xmin - (required) left edge of rectangle
    # xmax - (required) right edge of rectangle
    # ymin - (required) bottom edge of rectangle
    # ymax - (required) top edge of rectangle
  ), fill = "#f6f6f6") +
  # 添加文本标签"Institution"
  geom_text(
    label = "Institution", x = -0.675, y = dim(df)[1] + 1,
    size = txt.sz, color = "black", fontface = 2, hjust = 0
  ) +
  # 添加文本标签"Overall"
  geom_text(
    label = "Overall", x = 1.075, y = dim(df)[1] + 1,
    size = txt.sz, color = "black", fontface = 2
  ) +
  geom_text(
    label = "\u0394", x = 1.2, y = dim(df)[1] + 1,
    size = txt_sz, color = "black", fontface = 2, hjust = 0
  ) +
  geom_text(aes(x = x1, label = x1pr),
    size = txt_sz, color = "#e6956f",
    nudge_x = df$x1nu
  ) +
  # 在x2位置添加文本,显示x2的百分比值
  geom_text(aes(x = x2, label = x2pr),
    size = txt.sz,
    color = "#112fb3", nudge_x = df$x2nu
  ) +
  # 在固定位置添加文本,显示overall的百分比值
  geom_text(aes(x = x1 * 0 + 1.075, label = ovpr),
    size = txt.sz,
    color = "black"
  ) +
  # 在固定位置添加文本,显示差异的百分比值
  geom_text(aes(x = x1 * 0 + 1.2, label = dipr),
    size = txt.sz,
    color = "black"
  ) +
  # 添加线段,连接x1和x2点
  geom_segment(aes(x = x1, xend = x2, yend = cont),
    color = "gray40", linewidth = 1
  ) +
  # 在x1位置添加点
  geom_point(aes(x = x1),
    shape = 16, size = 2.5,
    color = "#E6956F"
  ) +
  # 在x2位置添加点
  geom_point(aes(x = x2),
    shape = 16, size = 2.5,
    color = "#E6956F"
  ) +
  # 设置y轴为离散值并调整扩展
  scale_y_discrete(expand = c(0, 0)) +
  # 设置x轴为连续值
  scale_x_continuous() +
  # 设置坐标轴范围和裁剪行为
  coord_cartesian(
    ylim = c(0.2, 12.5),
    xlim = c(0, 1.2), clip = "off"
  ) +
   # 应用自定义主题
  theme_cus